Reports turn your runs into performance insight: completion rate, average cycle time, SLA compliance, overdue rate, and the bottleneck slowing you down, over any time window.
5 min read · Managers & leaders
Reports
The health of your operation, at a glance
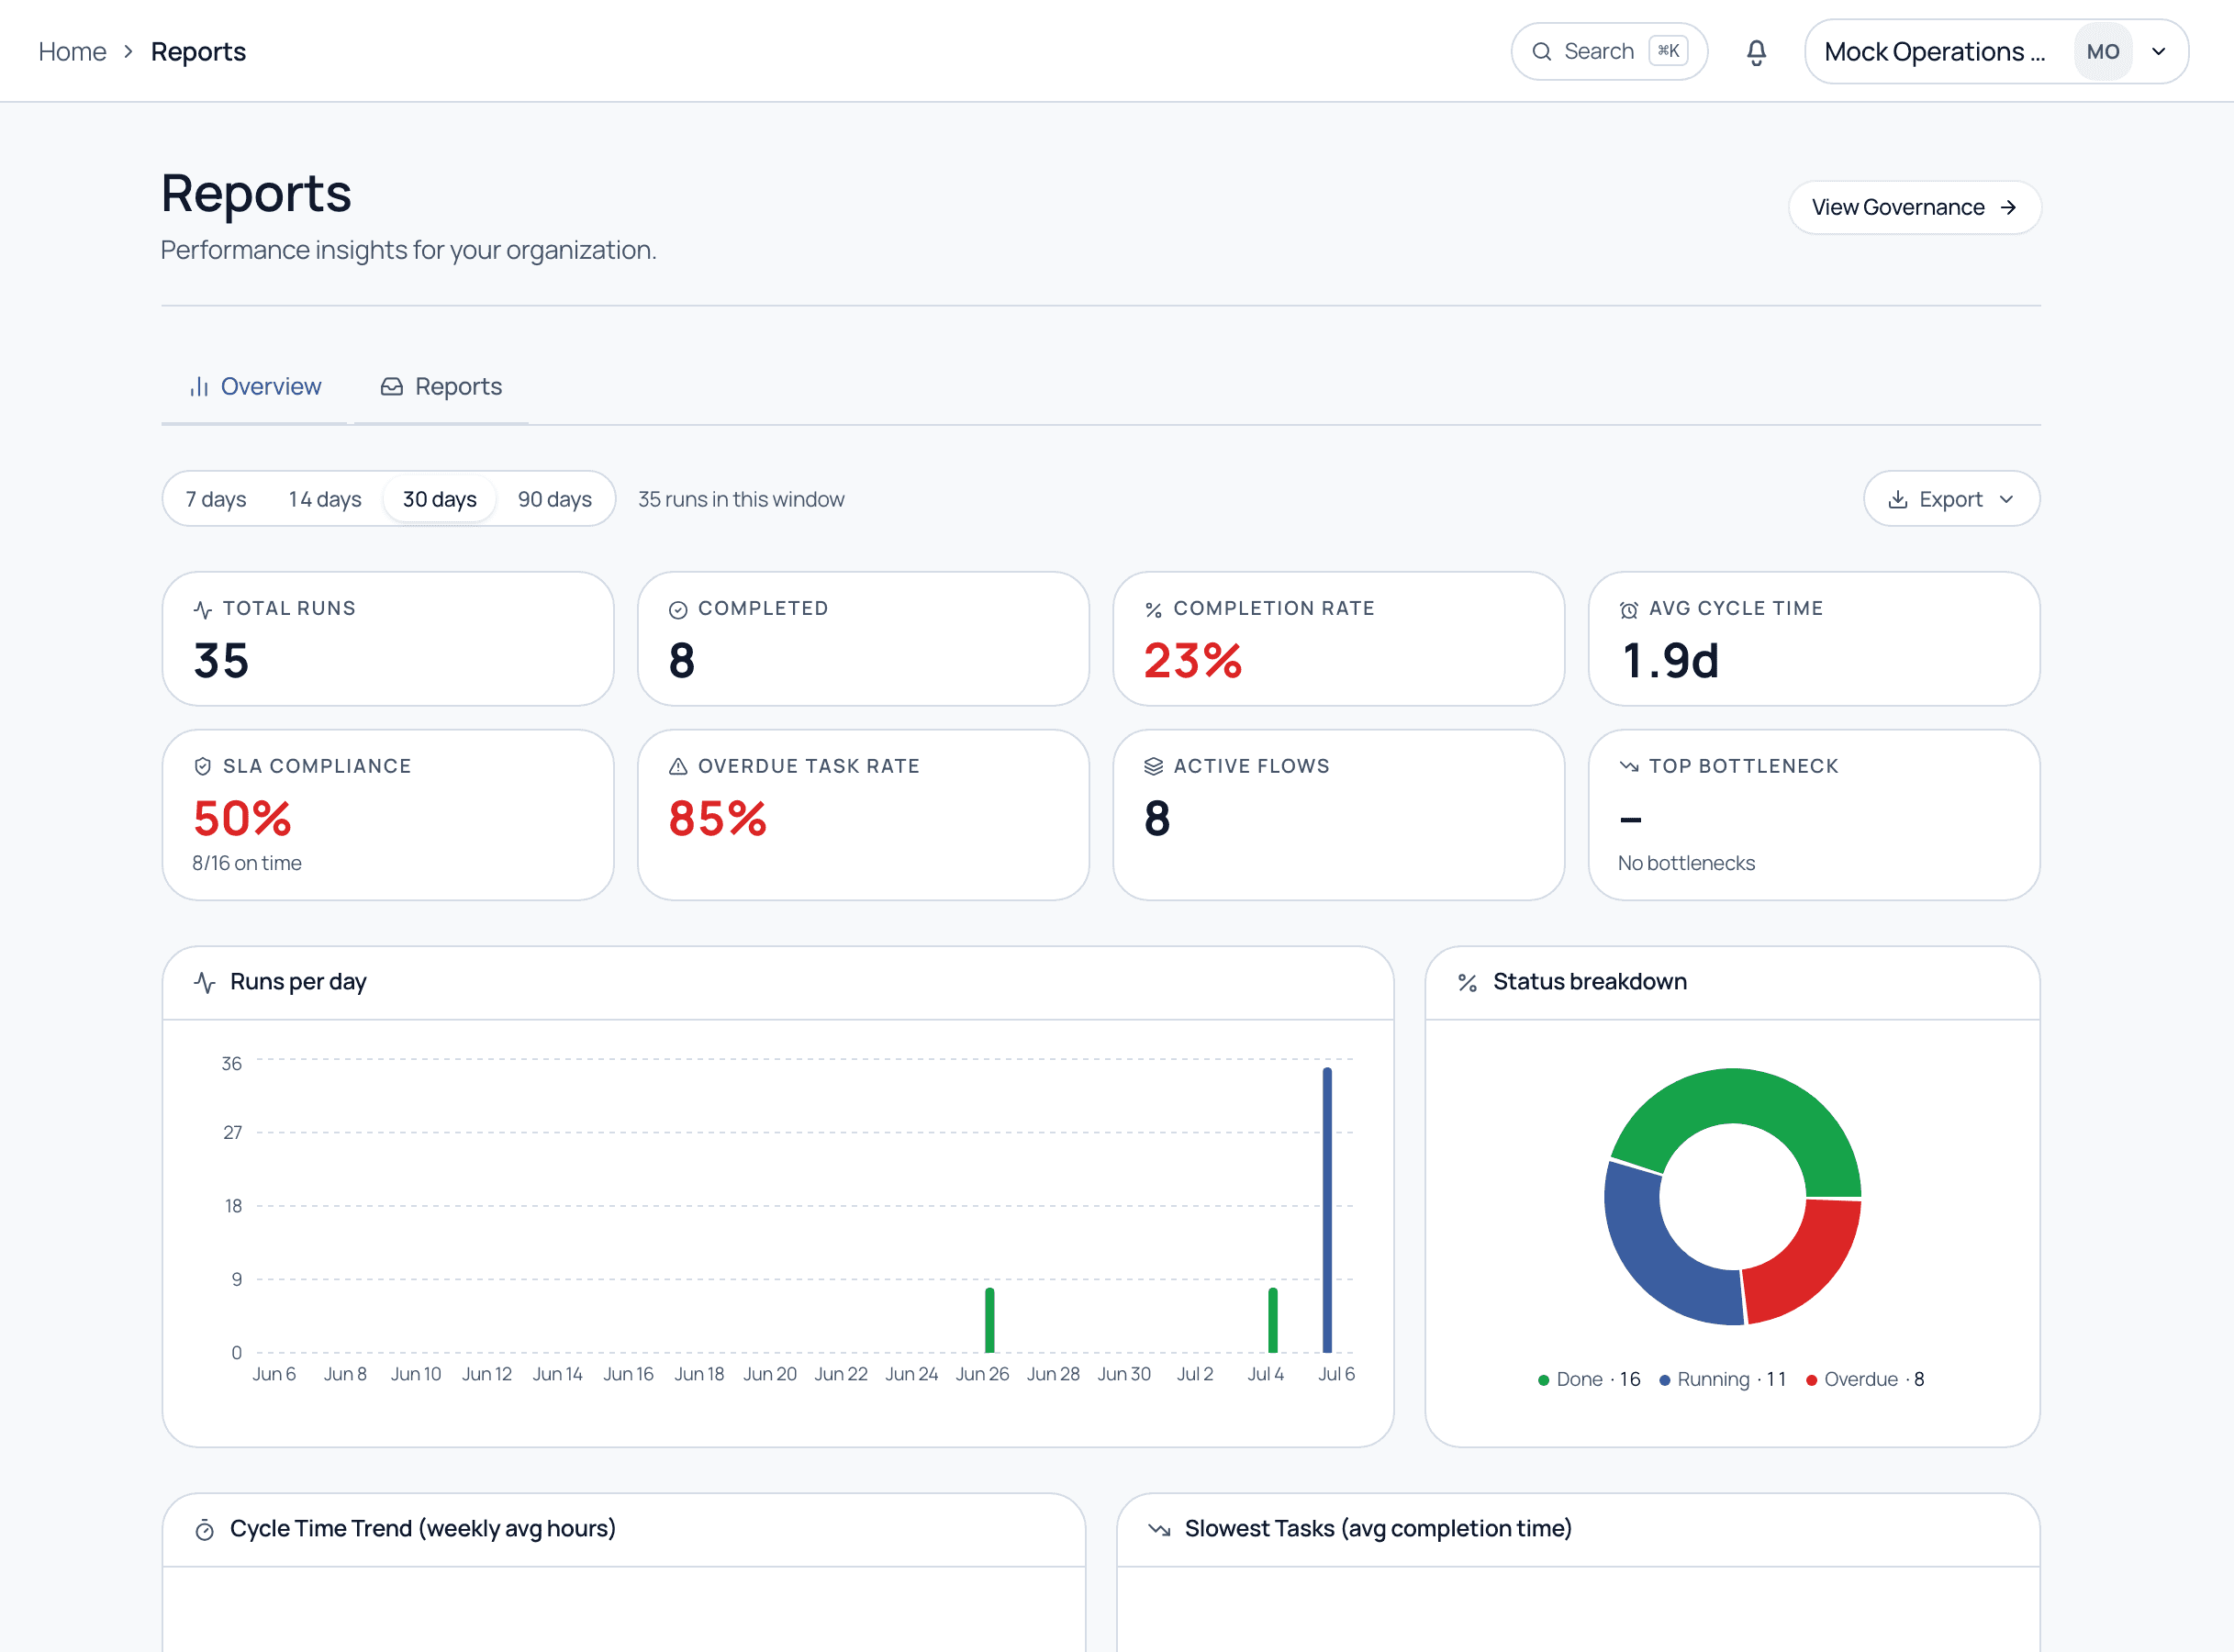
Reports lead with KPI cards, total runs, completed, completion rate, average cycle time, SLA compliance, overdue task rate, active flows, and top bottleneck, over a 7, 14, 30, or 90 day window. Below, charts break down runs per day, status mix, cycle-time trend, and the slowest tasks. Export any view.
Reports. KPI cards up top; runs-per-day, status breakdown, and cycle-time charts below.
The metrics that matter
What each KPI tells you
Completion rate: Share of runs finished in the window. A low rate signals abandoned or stuck processes.
Average cycle time: How long a run takes end to end. The core measure of process speed.
SLA compliance: Share of tasks completed within their SLA. Your on-time percentage.
Overdue task rate: Share of tasks past their deadline. A leading indicator of trouble.
Top bottleneck: The step slowing everything down, so you know exactly where to intervene.
Watch cycle time and the top bottleneck together. The bottleneck names the step to fix; cycle time tells you whether the fix actually moved the needle over the next window.
Common questions
How is cycle time calculated?
It is the elapsed time from a run starting to finishing, averaged across completed runs in the selected window. It measures real end-to-end process duration.
Can I export the data?
Yes. Use Export to pull the current view for a board deck or a deeper analysis in your own tools. Governance offers the raw event-level export.
Turn execution into insight
See the metrics that move your process on a guided demo.